| ☰ Menu | Preliminary design plan |
1 The University Centre in Svalbard (UNIS), Norway
2 Norwegian University of Science and Technology (NTNU), Trondheim, Norway
3 University of Oslo, Oslo, Norway
The general DIY recipe is outlined in previous work conducted [1-3] in the visible part of the spectrum (400-800 nm) where the aim was to construct HSI payloads for drones to small satellites. The result was the payload of the HYPer-spectral Smallsat for ocean Observation (HYPSO-1), launched into polar orbit on January 13, 2022.
Due to high atmospheric scattering seen in the violet blue part of the HYPSO-1 spectra below 450 nm and overlapping second order effects above 800 nm [4], a modification of the design is presented. The high NIR spectral sensitivity of the Black Silicon CMOS sensor makes it possible to shift the wavelength range up to 600-1200 nm. As a result, the shift will reduce scattering and remove unwanted second order effects.
The modified optical design is presented followed by a detailed description on how to mechanically collimate the diffractive grating and mount the optical elements in place by a 3D printed instrumental enclosure. Prior to wavelength and sensitivity calibration, the Black Silicon CMOS sensor was setup as a regular monochromatic aurora camera to test its low light capability. Finally, data samples of the assembled HSI are shown to verify image performance.
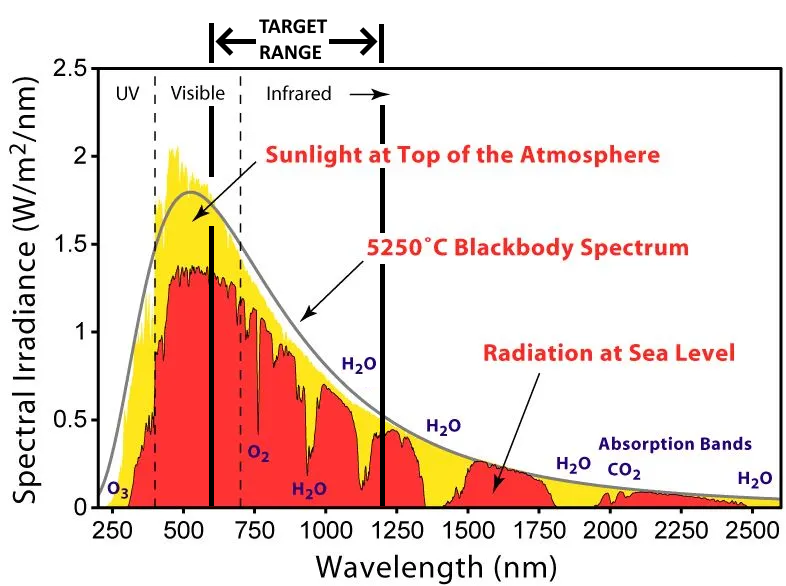
First, the source illumination in the NIR region can be identified in Figure 1. The target wavelength region 700 - 1100 nm is less intens compared to the visible part of the spectrum and dominated by two atmospheric absorption bands (O2 and H2O).
where n is the spectral order, λ is the wavelength, a the groove spacing, and β the diffracted angle.
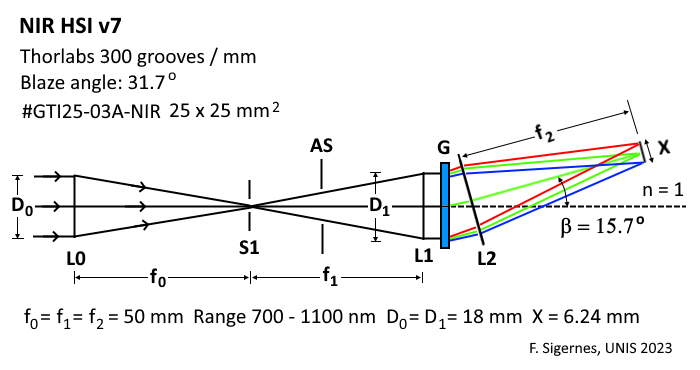
The optical diagram is shown in Figure 2. The center design wavelength is set to 900 nm. A 300 lines/mm blazed grating is the key element. Blaze angle is 31.7°. The efficiency is above 55% for the wavelength region 700 - 1100 nm. The effective aperture may be set to D0 = D1 = 18 mm which corresponds to ~ F/2.8 The input slit width is fixed with no magnification or demagnification of the height (h = 10 mm). Field Of View (FOV) along slit equals 11.4°. A slit width of w = 50 µm will result in a first order (n = 1) Full Width Half Maximum (FWHM) spectral bandpass of 3.33 nm.
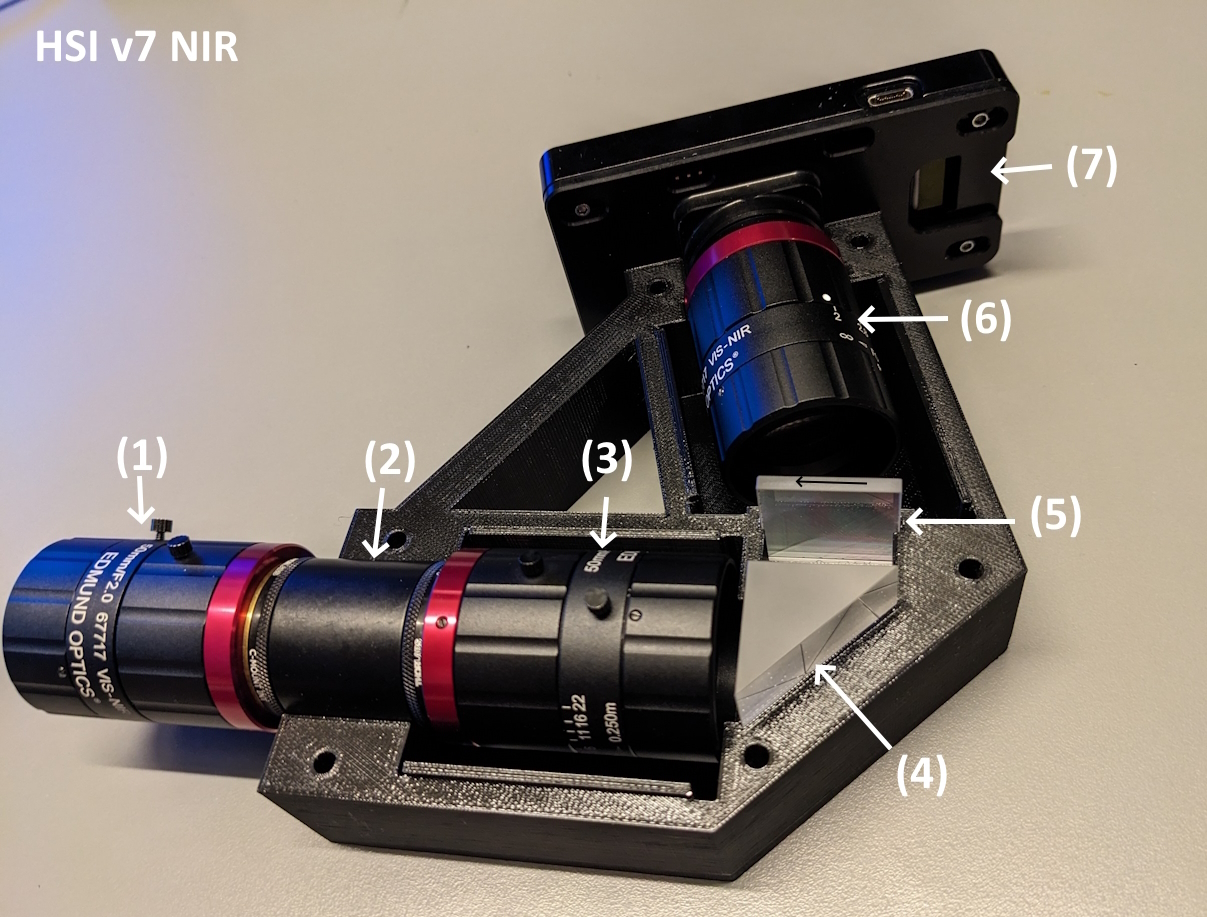
All components are off-the-shelf. Three 50 mm focal length VIS-NIR objectives from the company Edmund Optics (EO) is used in combination with a standard blazed transmitting grating from Thorlabs. The detector is a Black Silicon CMOS sensor from the company SiOnyx, LLC.
 |
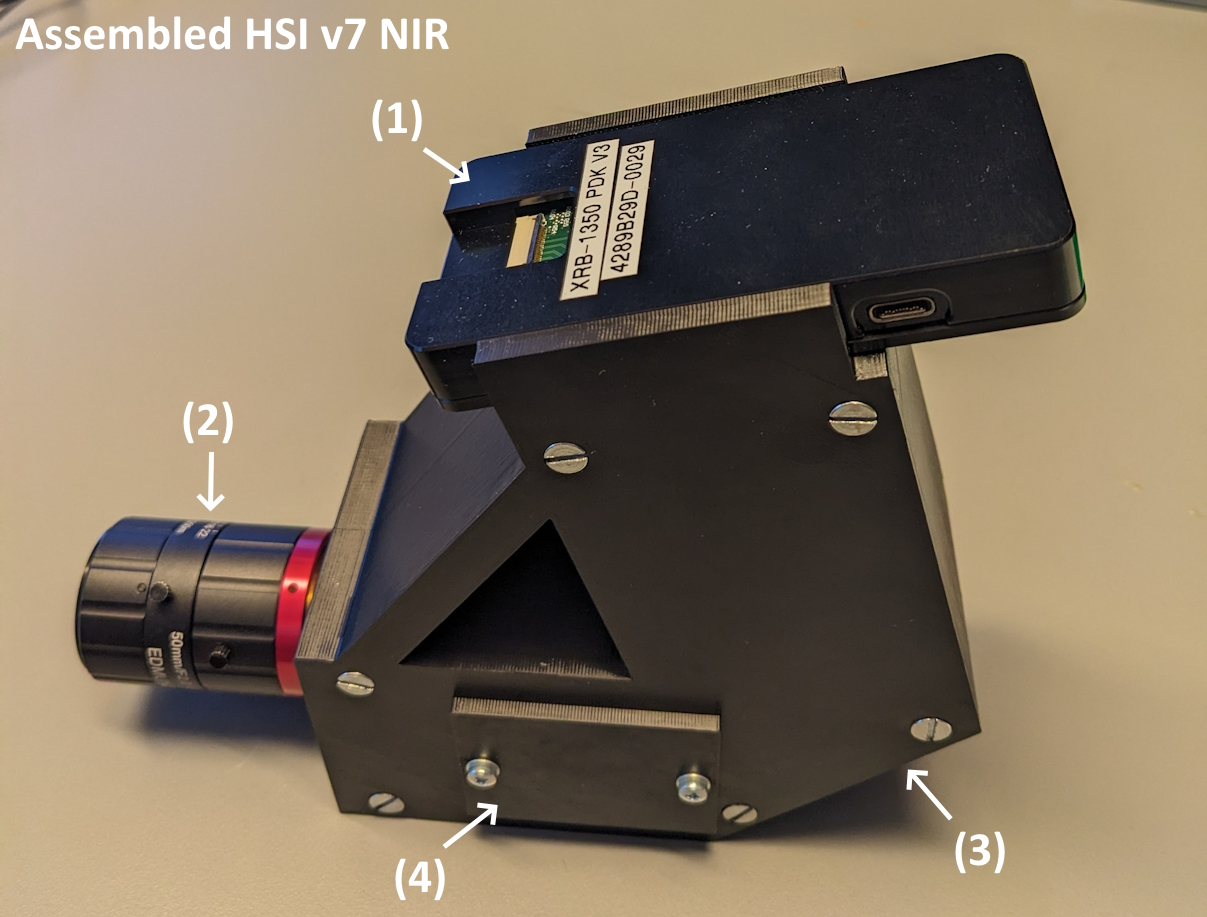 |
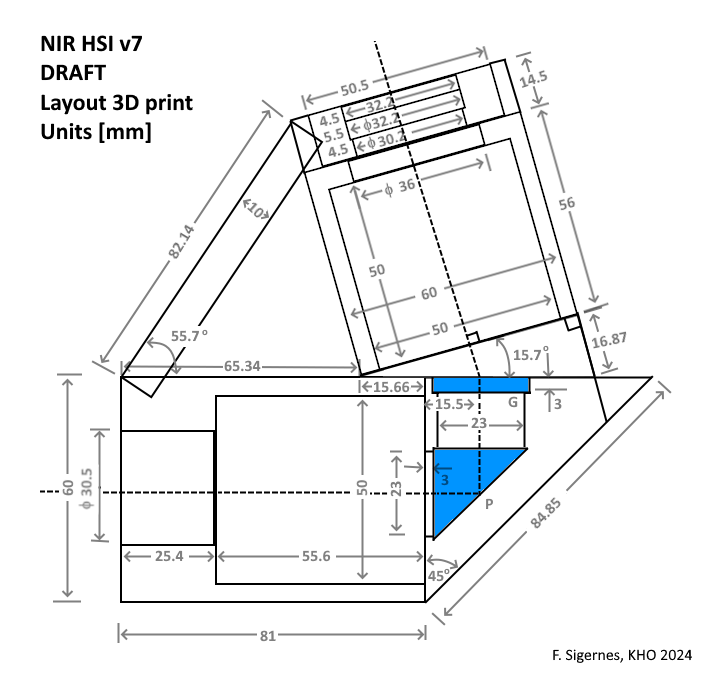
A 3D printed press fit solution is shown in Figure 5. A 3D printer from the company Prusa Research model Prusa i3 MK3S+ was used with a black PETG (Polyethylene Terephthalate modified with Glycol) filament. The material is known for its temperature resistance, tenacity, and flexibility. According to Prusa Research it does not shrink or warp, making it suitable for large print models.
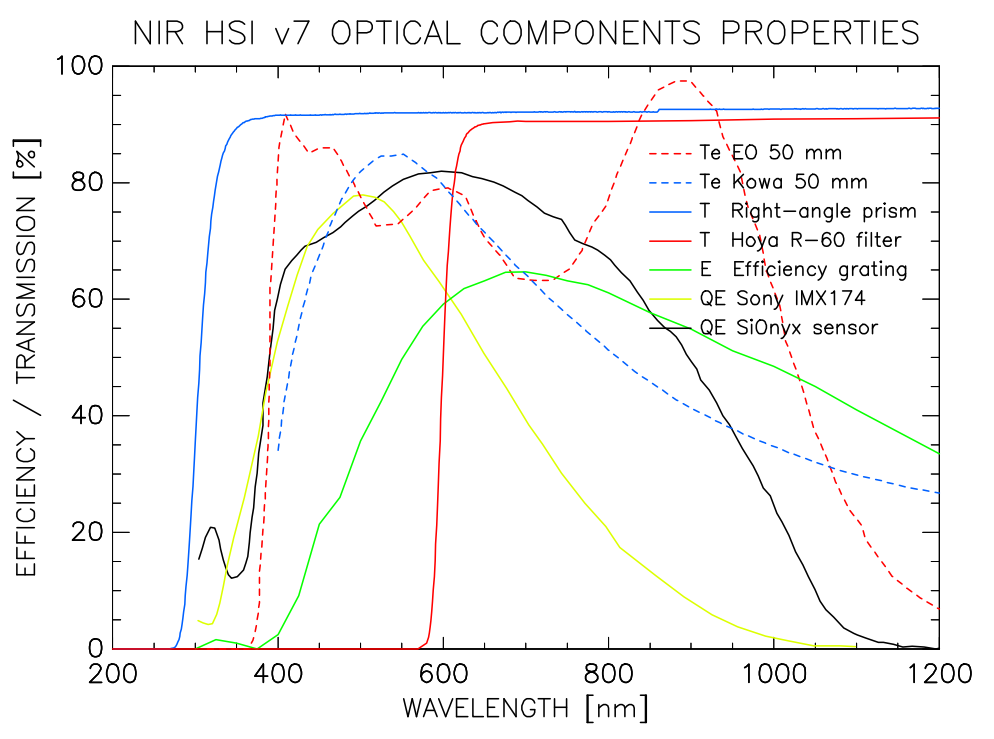
Each individual element in the optical train of the instrument has unique transmission and efficiency as listed in Table 2. Since the instrument uses three identical lens objectives, the effective transmission is calculated as
where T is the manufacture's transmission in units of %. The effective transmission of the EO VIS-NIR 50 mm lens objectives are shown in Figure 6. Included is the Thorlabs right-angle prism transmission, the EO Hoya R-60 second order longpass filter transmission, the Thorlabs transmitting grating efficiency and the SiOnyx Black Silicon CMOS sensor Quantum Efficiency (QE). These properties are vital to understand the results of the sensitivity calibration.
Snapshot image
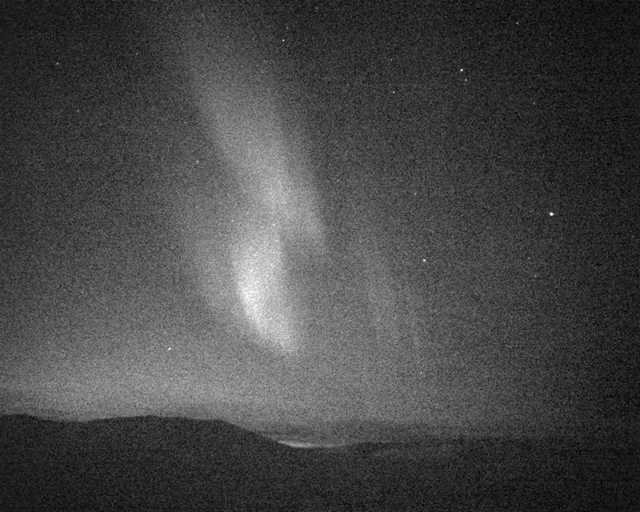
A snapshot image of a low intensity (1-2 kR) red colored post noon auroral arc was identified as soon as we turned the system on. See image below. Default automatic mode of camera was used. The gain was 3200 with an exposure time of just 11 msec running at 90 FPS.
Movie
A 60 second video timelaps is shown
here.
Note that the video is scaled down 4 times to reduce storage and the real duration is only 16.7s. Nevertheless, the above auroral experiment indicates that the sensor is low light sensitive and a promising candidate for our hyperspectral imager.
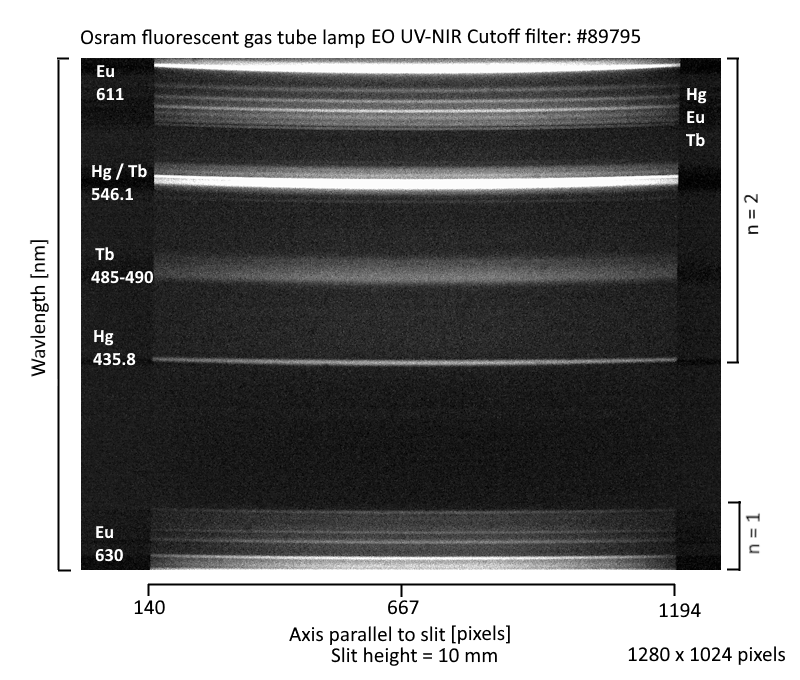
Note that due to lack of a spectral line source in NIR, a UV-NIR cutoff filter was mounted to the front lens (EO #89795). The latter to was done to identified well know emission line in the second order of the visible spectrum without the NIR part contributing from the first order. With well know emission lines identified in the second order, the corresponding first order NIR wavelengths become 2 times higher. This procure can be applied since the sensor is highly sensitive in the visible part of the spectrum.
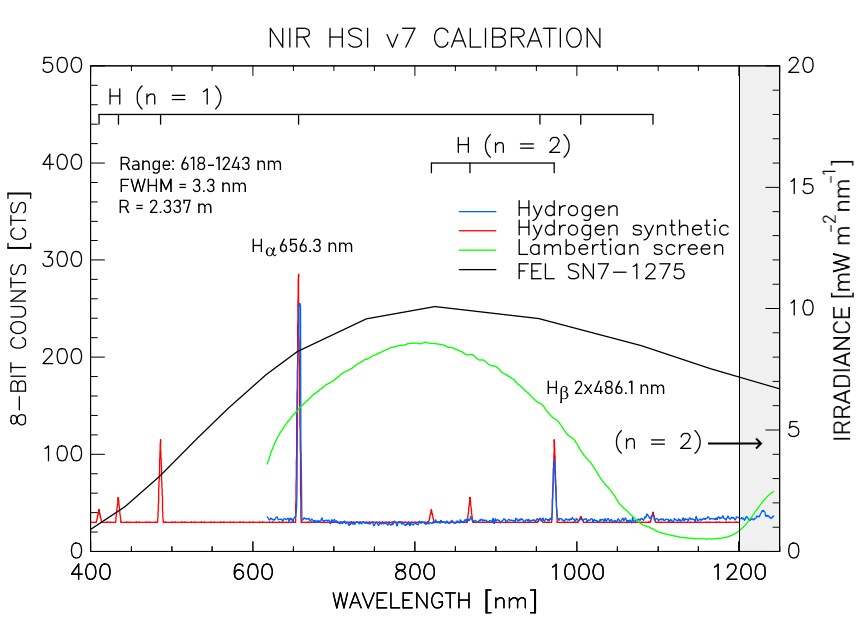
The instrument was wavelength calibrated using a hydrogen gas discharge spectral tube and the UV/NIR cut-off filter (EO #89795). The first order Hα line and the second order Hβ line was identified. The wavelength as a function of pixel value function is found to be
where p ∊ [0..1023] is pixel value. The spectral range becomes 618-1243 nm on the detector. Assuming Full Width Half Maximum (FWHM) spectral bandpass of 3.3 nm, the number of pixels per spectral bin becomes 5.4. A narrow spectral line may therefore be sampled by 12 pixels. This corresponds to 85 images generated from of the spectral data cube.
Sensitivity calibration is carried out by replacing the UV/NIR cut-off filter with a Red (Hoya R-60) longpass filter (EO #46545) to remove the second order visible part of the spectrum. The procedure and experimental setup for sensitivity calibration is explained in detail by [6]. The result is plotted in Figure 9.
To our surprise, the count rate is rapidly decreasing for wavelengths greater than 1000 nm, even though the source or screen illumination is high. The transmission and efficiency of all optical components are relatively high above 1000 nm, except the rapid fall in transmission in the EO 50 mm VIS-NIR objectives above 1050 nm. As a consequence, the Kowa VIS-NIR objective, which has high transmission in the upper end of the NIR wavelength region (1050-1200 nm), could be tested as a new candidate.
Furthermore, the Quantum Efficiency (QE) of the XQE-1350 sensor from SiOnyx is above 80% at 600 nm followed by a decrease down to 25% at 1000 nm, which also contribute to the rapid decline of sensitivity in the 1000-1200 nm range. To conclude, the result of sensitivity calibration, reduces the effective or usable spectral range to 600-1000 nm, regardless of lens candidates.
nm_UNIS_02042024_3nm.png)
The spectral imager was mounted to a Syrp Genie Mini II rotary table. A 30° horizontal sweep angle and period of 15 s were used. The target scenario is out an office window of UNIS towards East. The camera head operated at 90 FPS in automatic mode.
1000 frames were sampled by the Windows PC uTest64 program in is just 11 s. Each frame was rotated and accumulated into a spectral movie by ffmpeg. The latter procedure was used to make the hyper spectral data cube compatible with our Play Spectrogram software, which generated 3 spectral images at 700, 800 and 900 nm with image bandpass of 3.3 nm. The color composite is shown above.
Note that the analog gain was constant low at 100 during the sweep. The gain range is 100-3200. The exposure time varied from 6 - 6.5 msec. The effect of the automatic mode of the camera is seen in slight intensity changes in horizontal direction. Note that the image is resized vertically by 50% and auto-level color corrected by the program paint.net.
nm_UNIS_02072024_3nm.png)
The first test procedure was repeated on 02.07.2024 with summer target scenario towards West in Longyearbyen, recorded from the observation platform at the roof of UNIS. Again, the sensor operated at nominal 90 FPS, but now with a fixed exposure time at 11 msec. The horizontal background intensity variation along the sweep direction is the effect of the automatic analog gain, which varied from 200 to 341.
Objects or target areas such as blue sky, vegetation, buildings, and roads are clearly identified in the composite image. Furthermore, the single point spectrum of vegetation in Figure 12 shows the expected enhancement in intensity in the NIR 700-900 nm wavelength region, indicating healthy reflectance response.
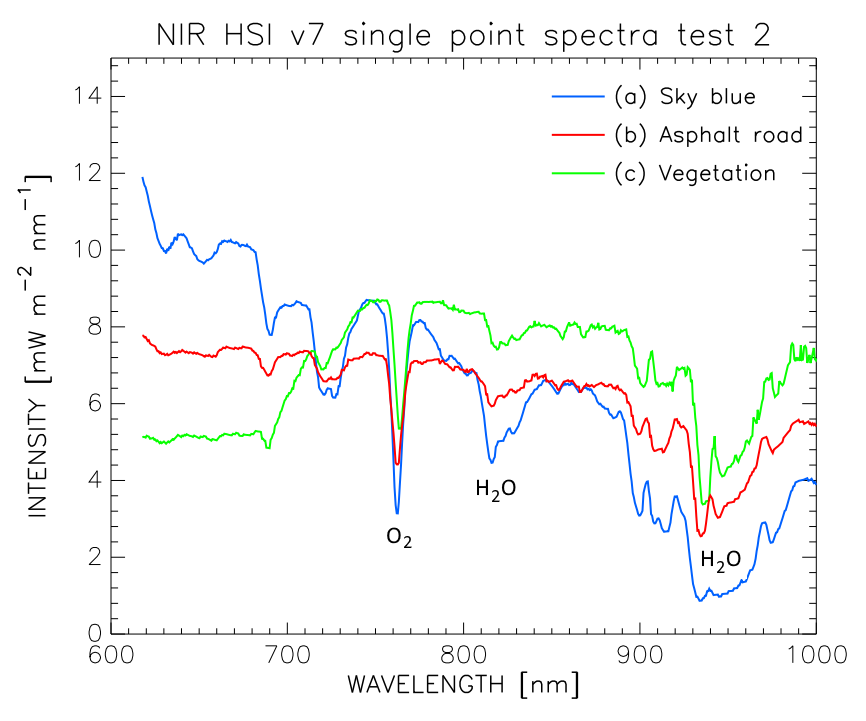
All point spectra, especially the clear blue sky spectrum, detects the atmospheric absorption bands of O2 and H2O water vapor with high contrast. These signatures may be used to track spectral shift and performance in orbit.
The assembled instrument operates 3 times faster than previous designs [1-4] due to increased sensitivity and processing speed. A nominal spectrogram readout rate of 90 versus 30 FPS, will increase the spatial resolution and decrease acquisition / sweep time in pushbroom mode. The target area for a drone or satellite based platform, may now be sampled faster.
The QE of the SiOnyx Black Silicon CMOS image sensor and the sensitivity calibration led to the conclusion that the spectral range is reduced to 600-1000 nm. A shift in center design wavelength down to 750 nm will increase the usable spectral range to 500-1000 nm. The shift will make more use of the active illuminated area of the image sensor. The latter will require a second order filter that cuts wavelengths below 500 nm. Candidates are the Hoya longpass filters W-Y495 or W-Y515.
As an extra bonus, since the SiOnyx sensor is highly sensitive in the visible part of the spectrum, it could also replace the Sony IMX174 CMOS currently used in the HSI v6 design. See QE in Figure 6.
Note that the above experiment was published [7] in Optica (2025).
| Item | Part / links | Description | Qty | Cost $ |
| 1 | VIS-NIR 50 mm | 50mm C VIS-NIR Series Fixed Focal Length Objective * | 3 | 1785 |
| 2 | EO 2nd order filter | M30.5 x 0.5 mounted Hoya R-60 red filter | 1 | 54 |
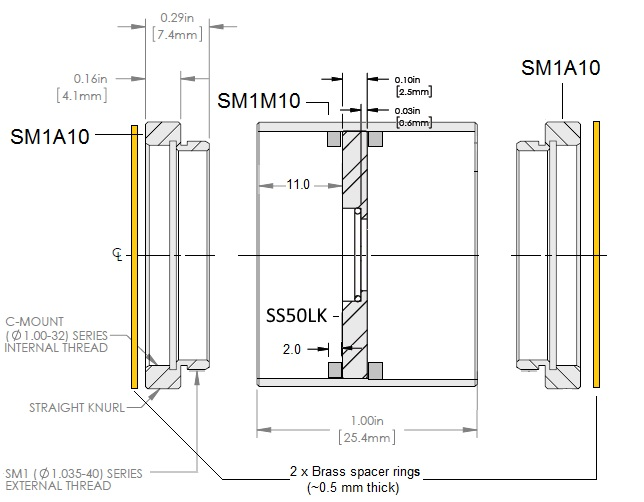
| 3 | Thorlabs SM1A10 | Adapter ring SM1 - C- mount internal | 2 | 45 |
| 4 | Thorlabs SM1M10 | SM1 lens tube 1 inch long with internal threads | 1 | 17 |
| 5 | Thorlabs S50LK | Fixed high precision mounted slit 10 mm x 50μm | 1 | 122 |
| 6 | Thorlabs Spacer Rings | Thorlabs C-mount 0.25-2mm space ring kit | 1 | 121 |
| 7 | Thorlabs GTI25-03A-NIR | (25 x 25) mm 2 Blazed Trans. grating (300 grooves/mm) | 1 | 118 |
| 8 | Thorlabs right-angle prism | N-BK7 Right-Angle Prism, Uncoated, L = 25 mm | 1 | 65 |
| 9 | SiOnyx RD board | Black Silicon sensor (12.3 x 9.9) mm2-9.5μm sized pixels | 1 | 790 |
| 10 | 3D printer material | PRUSA Jet Black PETG filament | 1 | 27 |
| New candidates | Date:11.06.2024 | |||
| 11 | Thorlabs S30LK | Fixed high precision mounted slit 10 mm x 30μm | 1 | 128 |
| 12 | Kowa VIS-NIR 50 mm | 1" Ruggedized 50mm 5MP C-Mount Lens | 3 | 1833 |
| Total | 13 | 5105 |
Table 1. Detailed part list NIR HSI v7.
| Item | Component | Property |
| 1 | EO VIS-NIR 50 mm objective | Transmission |
| 2 | Kowa VIS-NIR 50 mm objective | Transmission |
| 3 | Thorlabs right-angle prism | Transmission |
| 4 | EO Hoya R-60 red filter | Transmission |
| 5 | Thorlabs transmission grating | Efficiency |
| 6 | SiOnyx Black Silicon sensor | Efficiency |
Table 2. Optical component transmission and efficiencies. Data acquired from manufacturing companies.
- Fred Sigernes, Mikko Syrjäsuo, Rune Storvold, João Fortuna, Mariusz Eivind Grøtte, and Tor Arne Johansen, Do it yourself hyperspectral imager for handheld to airborne operations, Opt. Express 26, 6021-6035 (2018), https://doi.org/10.1364/OE.26.006021
- M. E. Grøtte, R. Birkeland, E. Honore-Livermore, S. Bakken, J. L. Garrett, E. F. Prentice, F. Sigernes, M. Orlandic, J. T. Gravdahl, T. A. Johansen, Ocean Color Hyperspectral Remote Sensing with High Resolution and Low Latency - the HYPSO-1 CubeSat Mission, IEEE Trans. Geoscience and Remote Sensing, Vol. 60, pp. 1-19 (2022), https://doi.org/10.1109/TGRS.2021.3080175
- M. Henriksen, E. Prentice, C. van Hazendonk, F. Sigernes, and T. Johansen, Do-it-yourself VIS/NIR pushbroom hyperspectral imager with C-mount optics, Opt. Continuum 1, 427-441 (2022), https://doi.org/10.1364/OPTCON.450693
- S. Bakken, M. B. Henriksen, R. Birkeland, D. D. Langer, A. E. Oudijk, S. Berg, Y. Pursley, J. L Garrett, F. Gran-Jansen, E. Honore- Livermore, M. E. Grøtte, B. A. Kristiansen, M. Orlandic, P. Gader, A. J. Sørensen, F. Sigernes, G. Johnsen and T. A. Johansen, HYPSO-1 CubeSat: First Images and In-Orbit Characterization, Remote sensing, 15(3), 755 (2023), https://www.mdpi.com/2072-4292/15/3/755
-
Albert, Kinga, SvalPoint: A Multi-track Optical Pointing System, Luleå University of Technology / UNIS, Master's Thesis, (2014),
https://kho.unis.no/doc/Thesis_KingaAlbert.pdf
- F. Sigernes, J. M. Holmes, M. Dyrland, D. A. Lorentzen, S. A. Chernous, T. Svenøe, J. Moen, and C. S. Deehr, Absolute calibration of optical devices with a small field of view, J. Opt. Technol. 74(10), 669-674 (2007). https://opg.optica.org/jot/abstract.cfm?uri=jot-74-10-669
- Fred Sigernes, Roger Birkeland, Joseph Landon Garrett, Henrik Øvrebø, Håvard Brovold, Sivert Bakken, Gaspar Mougin-Trichon, and Tor Arne Johansen, Near infra-red black silicon pushbroom hyperspectral imager, Opt. Continuum 4, 454-465 (2025), https://doi.org/10.1364/OPTCON.549308